AGEAS-Project
Insurance Claim Modeling with Random Forest
Frequency–Severity Approach
TL;DR
Two-part insurance risk model:
- Frequency → probability of a claim
- Severity → size of a claim
Combining both:
Expected Loss = Frequency × Severity
This project applies Random Forest models to capture nonlinear risk patterns and analyze insurance portfolio behavior.
Problem
Insurance risk is not a single prediction problem.
Instead, expected loss is modeled as:
Expected Cost = Frequency × Severity
Where:
- Frequency = likelihood of a claim
- Severity = cost given a claim
This structure better reflects real-world insurance pricing.
Methodology
Frequency Model
- Random Forest Classifier
- Predicts claim probability
Severity Model
- Random Forest Regressor
- Predicts claim size
Final Output
- Combined into Expected Loss per customer
Key Results
Business Impact: Total Expected Loss per Segment
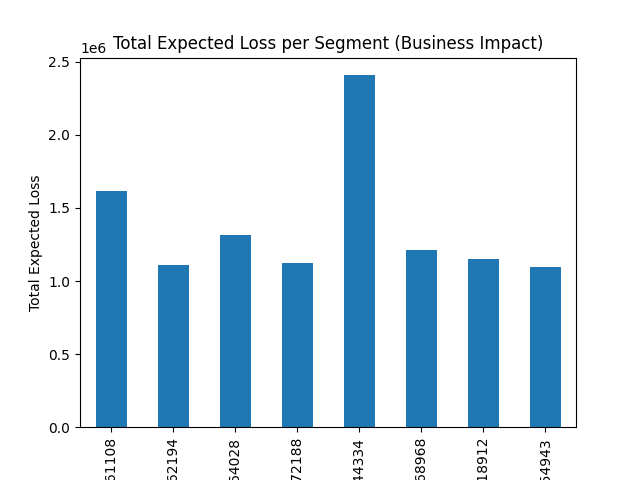
Some segments contribute disproportionately to total loss.
This highlights that portfolio concentration is as important as individual risk.
Risk Structure: Frequency vs Severity
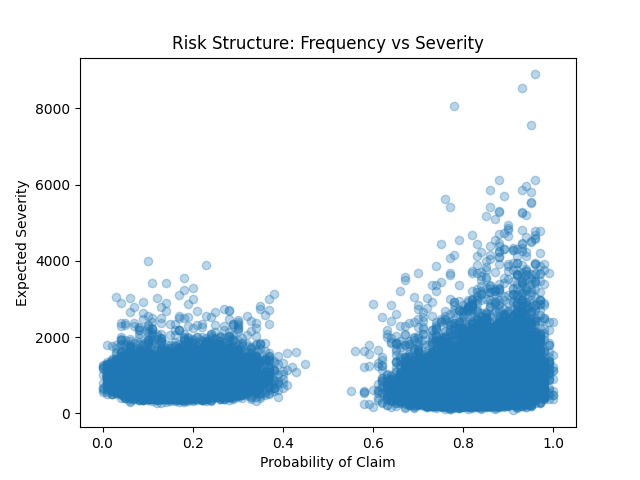
There is a clear nonlinear relationship:
- High claim probability often coincides with high severity
- Risk is clustered rather than evenly distributed
Feature Importance (Frequency Model)
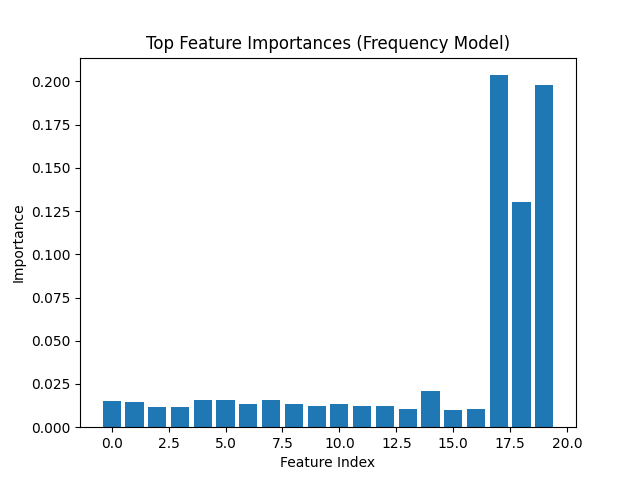
A small number of features dominate prediction power,
suggesting strong underlying drivers of claim occurrence.
Interpretable Segmentation (Surrogate Tree)
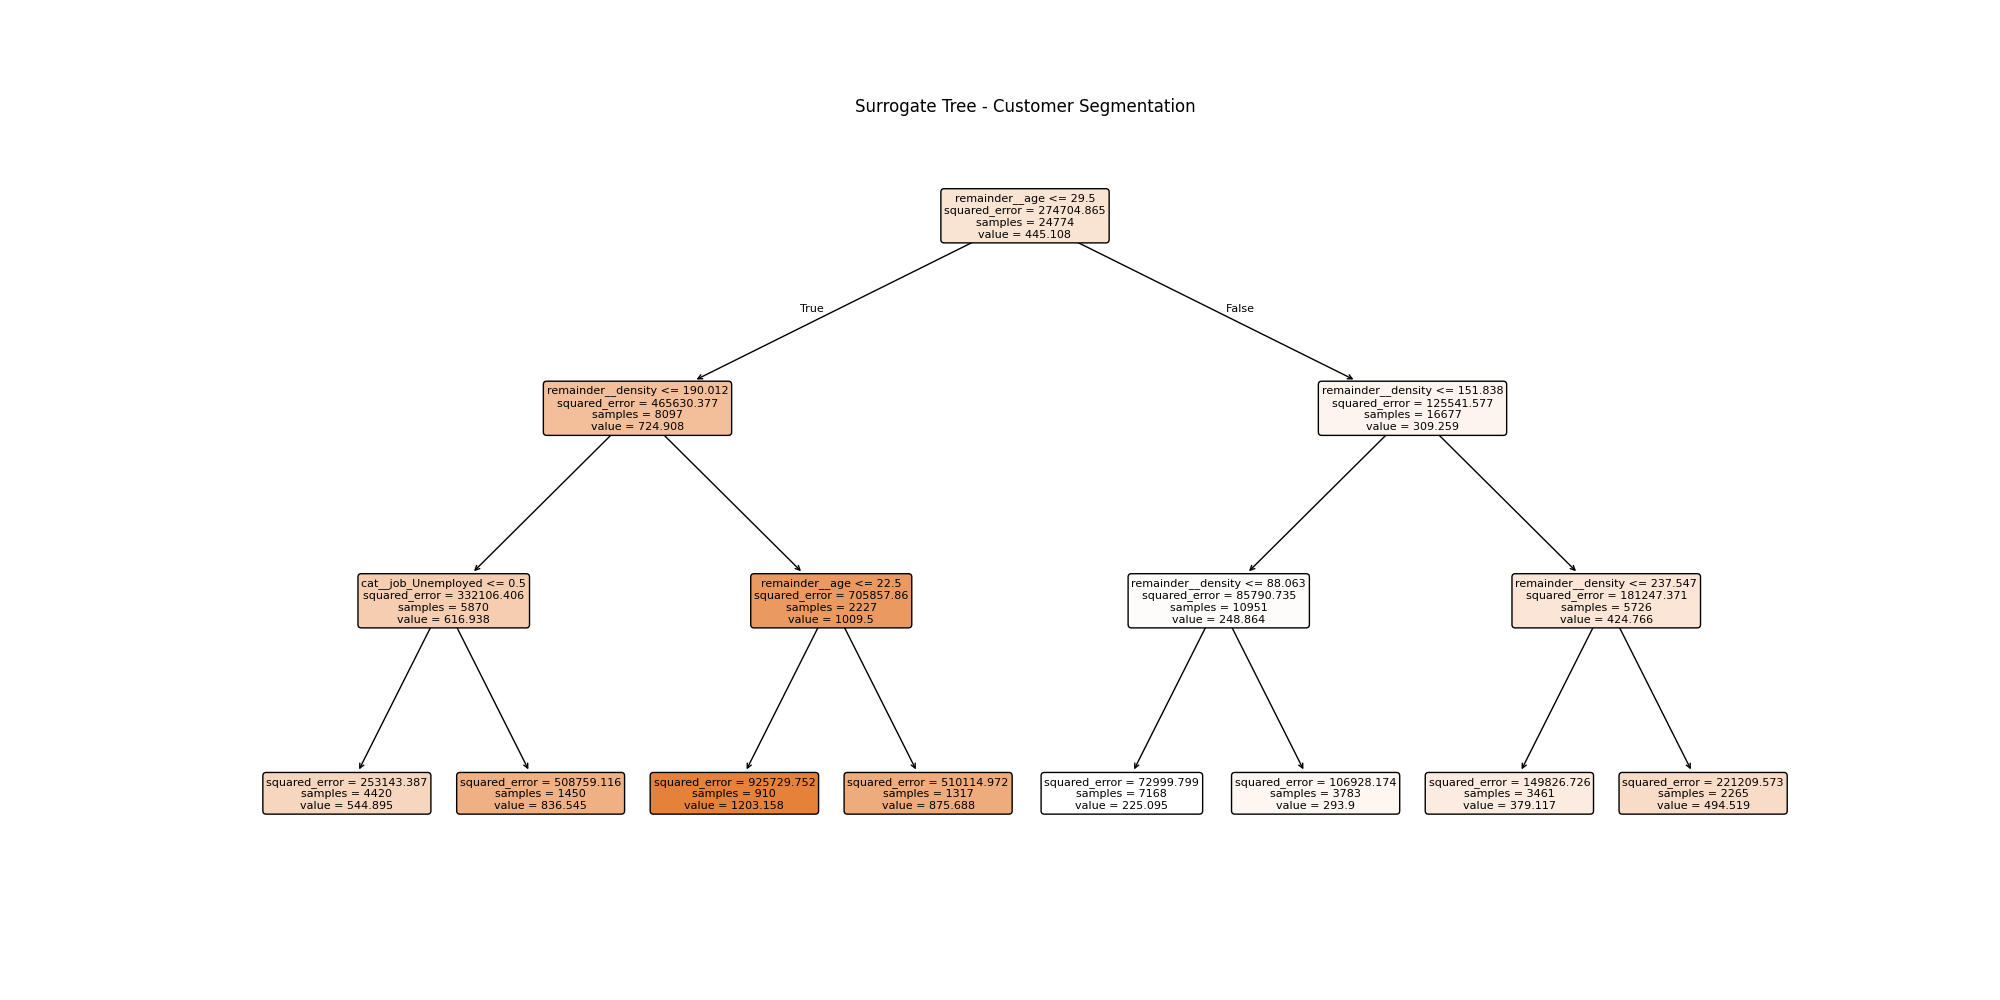
A decision tree approximation of the model reveals:
- Clear segmentation rules
- Key thresholds driving risk differences
- Interpretable structure behind a complex model
Distribution of Expected Loss
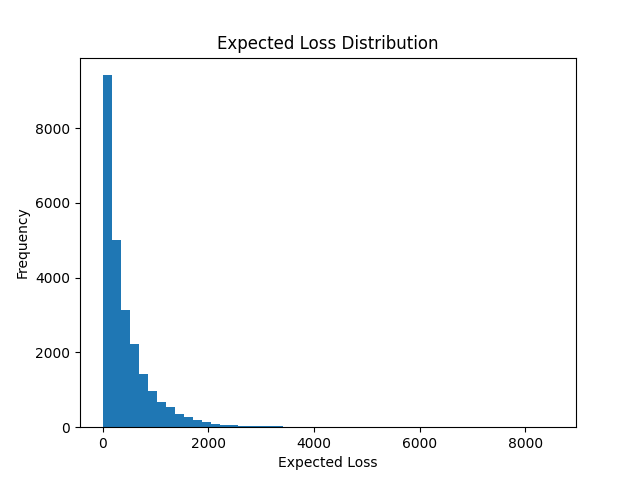
The distribution is highly skewed:
- Most customers have low expected loss
- A small group drives extreme risk
This is typical in insurance and reinforces the need for segmentation.
Portfolio-Level Insights
Customer Segmentation Overview
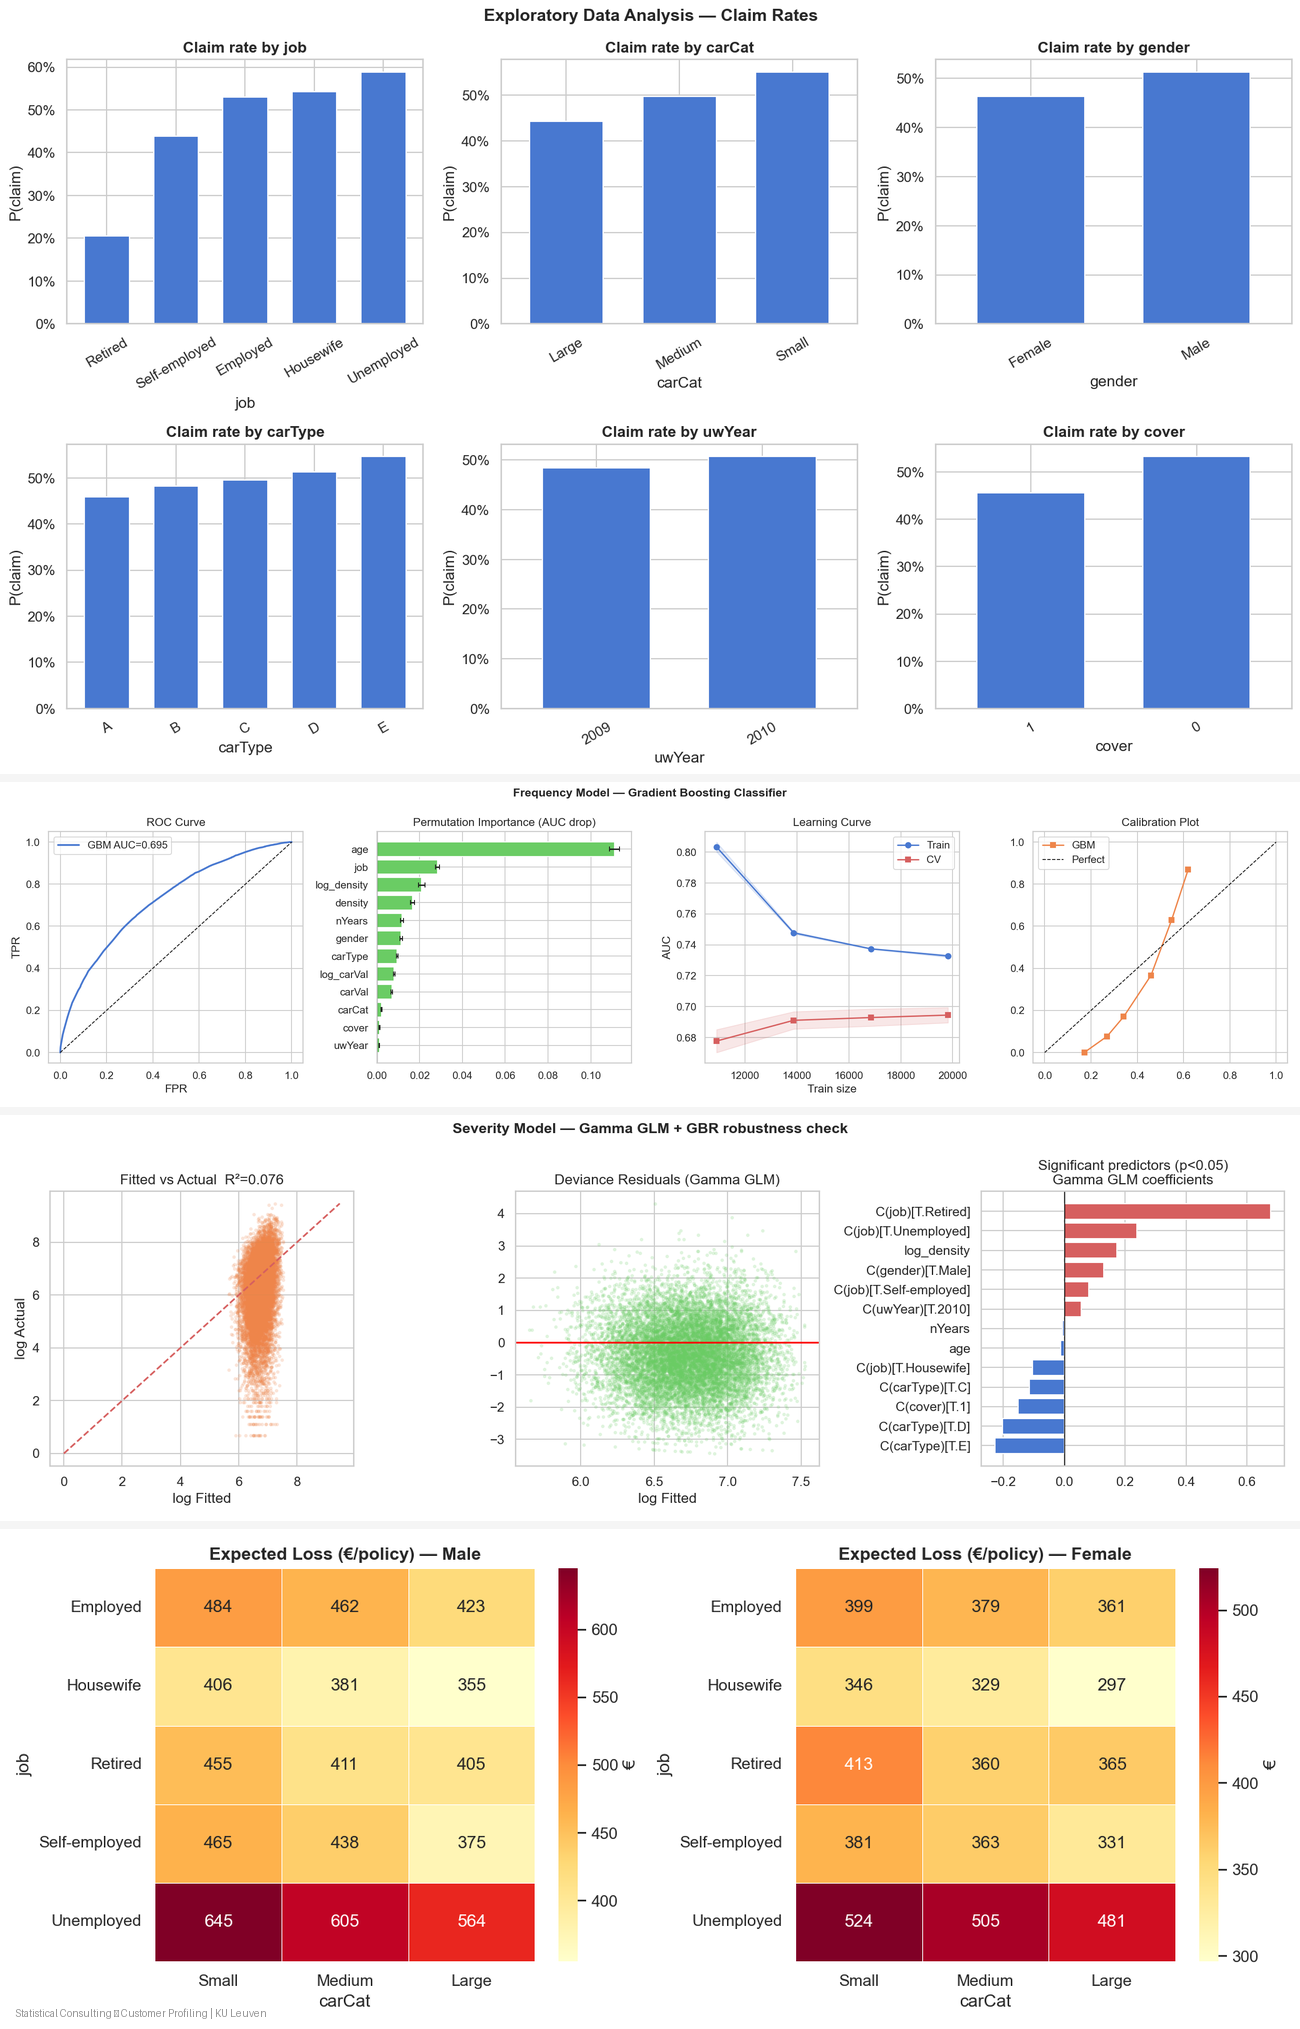
- High-risk groups are identifiable
- Job category, car type, and demographics affect claim behavior
- Certain segments consistently exhibit elevated expected loss
Key Takeaways
- Modeling frequency and severity separately improves realism
- Risk is nonlinear and concentrated in specific segments
- Random Forest captures interactions that linear models miss
- A small subset of customers drives a large share of total loss